Grafana
- Source: https://github.com/grafana/grafana
- License: AGPL 3.0
- UI:
https://grafana.<domain> - Credentials:
EXIST_USERNAME/EXIST_PASSWORD(set via.env.shared)
Dashboards for Prometheus metrics and Loki logs, provisioned from code.
What's provisioned
| Resource | File | Purpose |
|---|---|---|
| Prometheus datasource | provisioning/datasources/prometheus.yaml | Default datasource, 15s scrape interval |
| Loki datasource | provisioning/datasources/loki.yaml | Log queries, max 1000 lines |
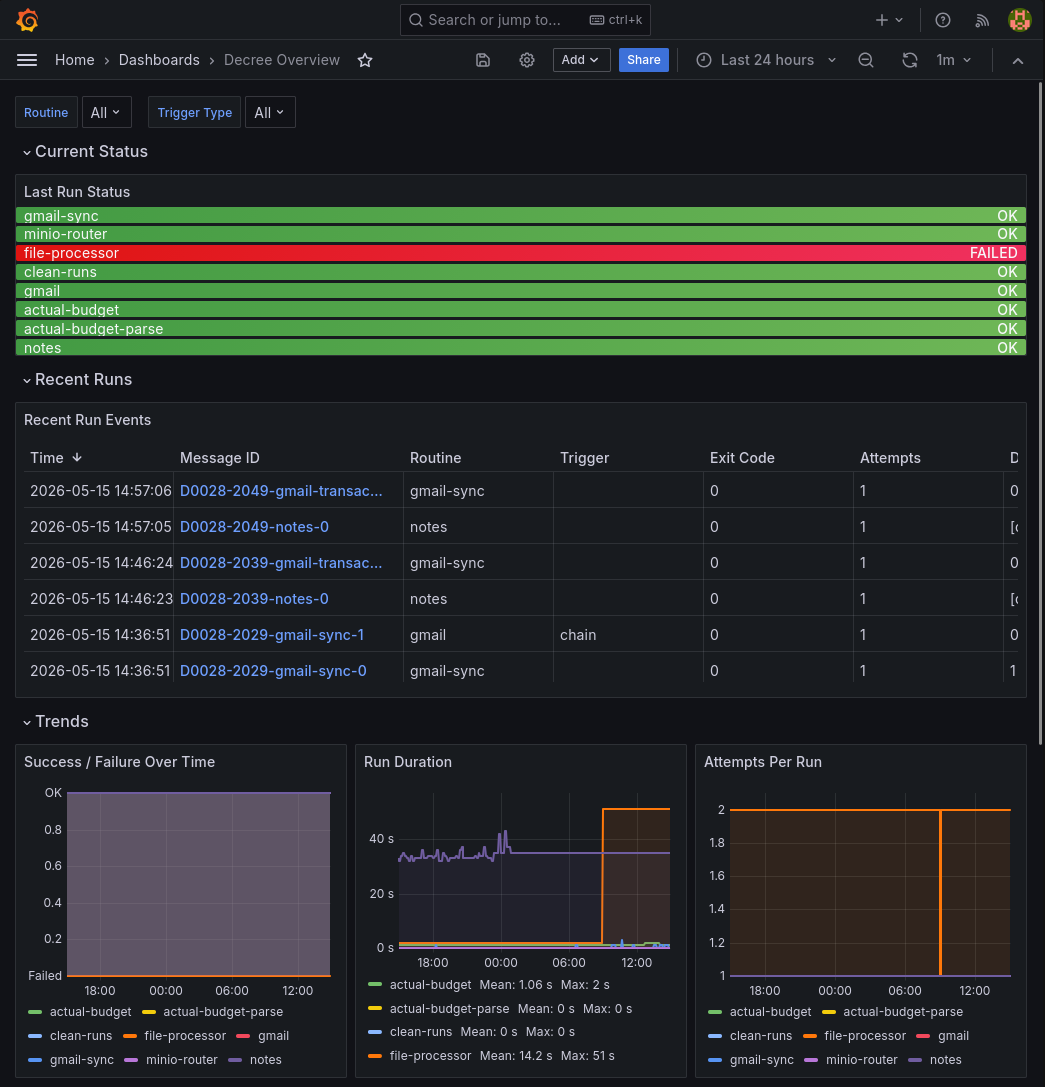
| Decree Overview dashboard | provisioning/dashboards/decree-overview.json | Pre-built Decree monitoring |
| Decree Run Detail dashboard | provisioning/dashboards/decree-run-detail.json | One run's events.jsonl and script output, by run ID |
| Hosts dashboard | provisioning/dashboards/hosts.json | Every host that reports: free disk space, installed decree machines, each one's last run (Controller and Workers) |
| decree alert | provisioning/alerting/decree.yaml | A failed automation-backup run → one ntfy notification |
Grafana re-reads the dashboards directory every 30 seconds, so a dashboard JSON edit lands without a restart. Datasource provisioning is applied at startup only — restart grafana after editing a datasource YAML.
Decree Overview dashboard
Covers both decree daemons, filterable by daemon and machine, with panels for:
- Runs in range — finished runs per machine, done and failed (Prometheus)
- Run duration — p95 per machine (Prometheus histogram)
- Finished runs per hour — stacked by final state
- Recent runs — one row per run (Loki, the
run_finishedevents): machine, final state, duration, trigger, and the run ID, linking to the Run Detail dashboard
This is the main place to check when a Decree automation fails or behaves unexpectedly.
Extending
- New dashboard: drop a JSON export into
hosting/grafana/provisioning/dashboards/. Grafana auto-loads it. - New datasource: add a YAML file to
hosting/grafana/provisioning/datasources/. - Alerts: unified alerting.
provisioning/alerting/decree.yamlprovisions the ntfy contact point (a webhook, authenticated asEXIST_NTFY_USER) and thedecree run failedrule, onincrease(decree_runs_total{daemon="automation-backup",state="failed"}[10m]) > 0, repeating at most every 6 hours per machine. Theautomationdaemon reports its own runs without Grafana (When a run needs you), so it is left out. Rules made in the UI persist in thegrafana_datavolume.
Data flow summary
<project>/runs/<id>/events.jsonl, <NNNN>-<state>-<script>.log
  └─ Alloy
       ├─ Loki (every event and every script's output)
       └─ /metrics → Prometheus (decree_runs_total, decree_run_duration_milliseconds)

Grafana
  ├─ queries Prometheus for metric panels
  └─ queries Loki for log panels